This is the first in a series of posts on how members of the European Parliament (MEPs) appear on Twitter. The first post will introduce the EP twittersphere, outline limitations to the analysis, and point at some broad trends. The following posts will focus on specific aspects.
The dataset at the base of this and the following posts consists of 1,500,680 tweets (yes, about one and a half million tweets) posted by current MEPs.1
You can explore interactively the last three months of tweets posted by MEPs in EdjNet’s latest tool, the QuoteFinder.
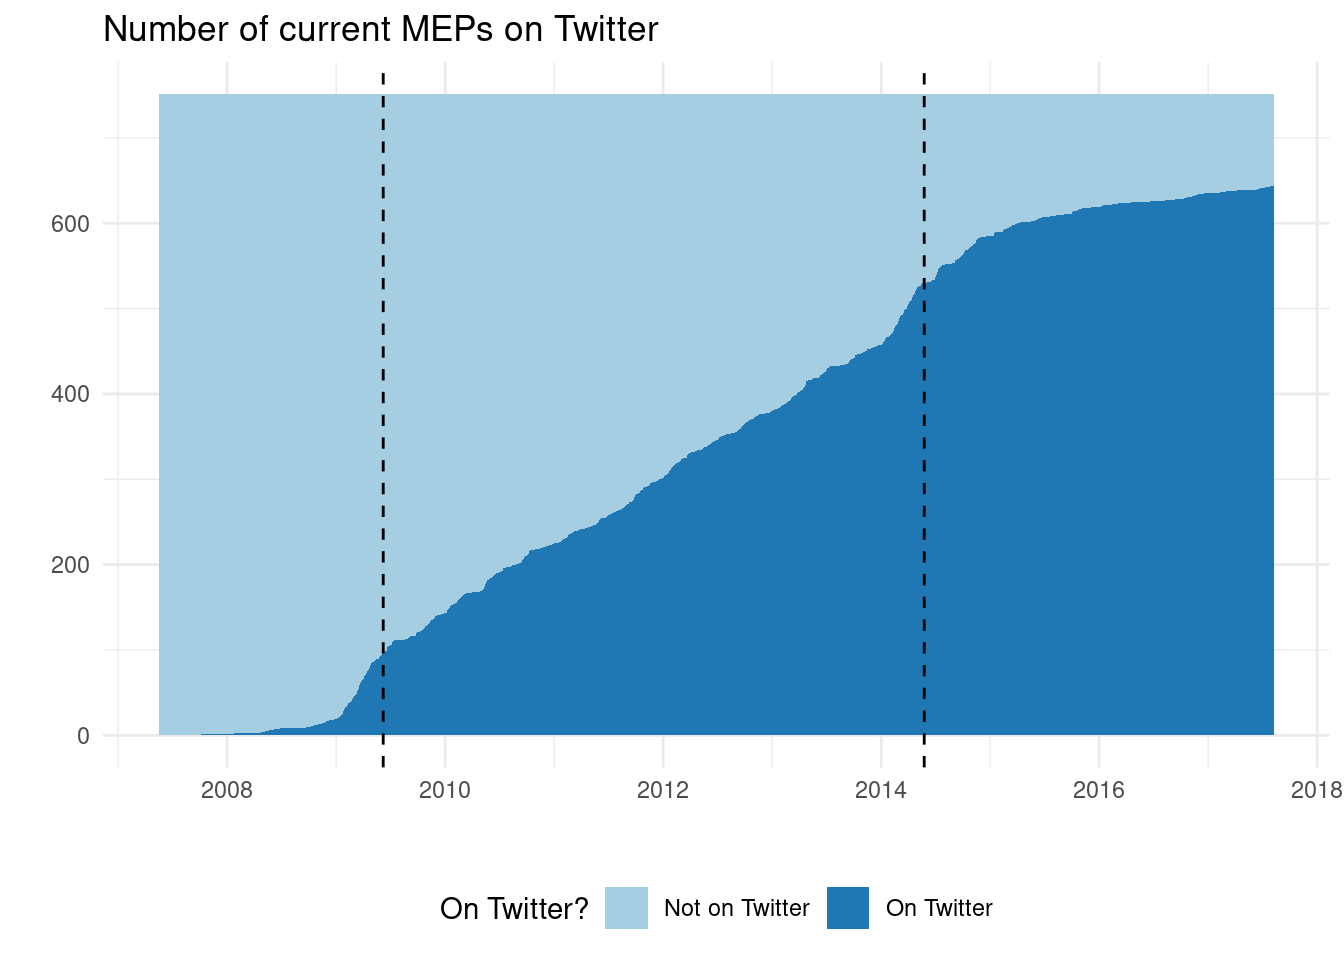
How many are actually on Twitter?
The vast majority of MEPs is currently on Twitter (more than 600 out of 751 MEPs). Only few joined in the early years of the platform, and electoral campaigns seem to serve as an encouragement for MEP to sign up to social media platforms in order to reach a wider audience. Small “bumps” in the total numbers of current MEPs on Twitter is visible both before the EP election in June 2009, and the latest election in May 2014.2
How much do they tweet?
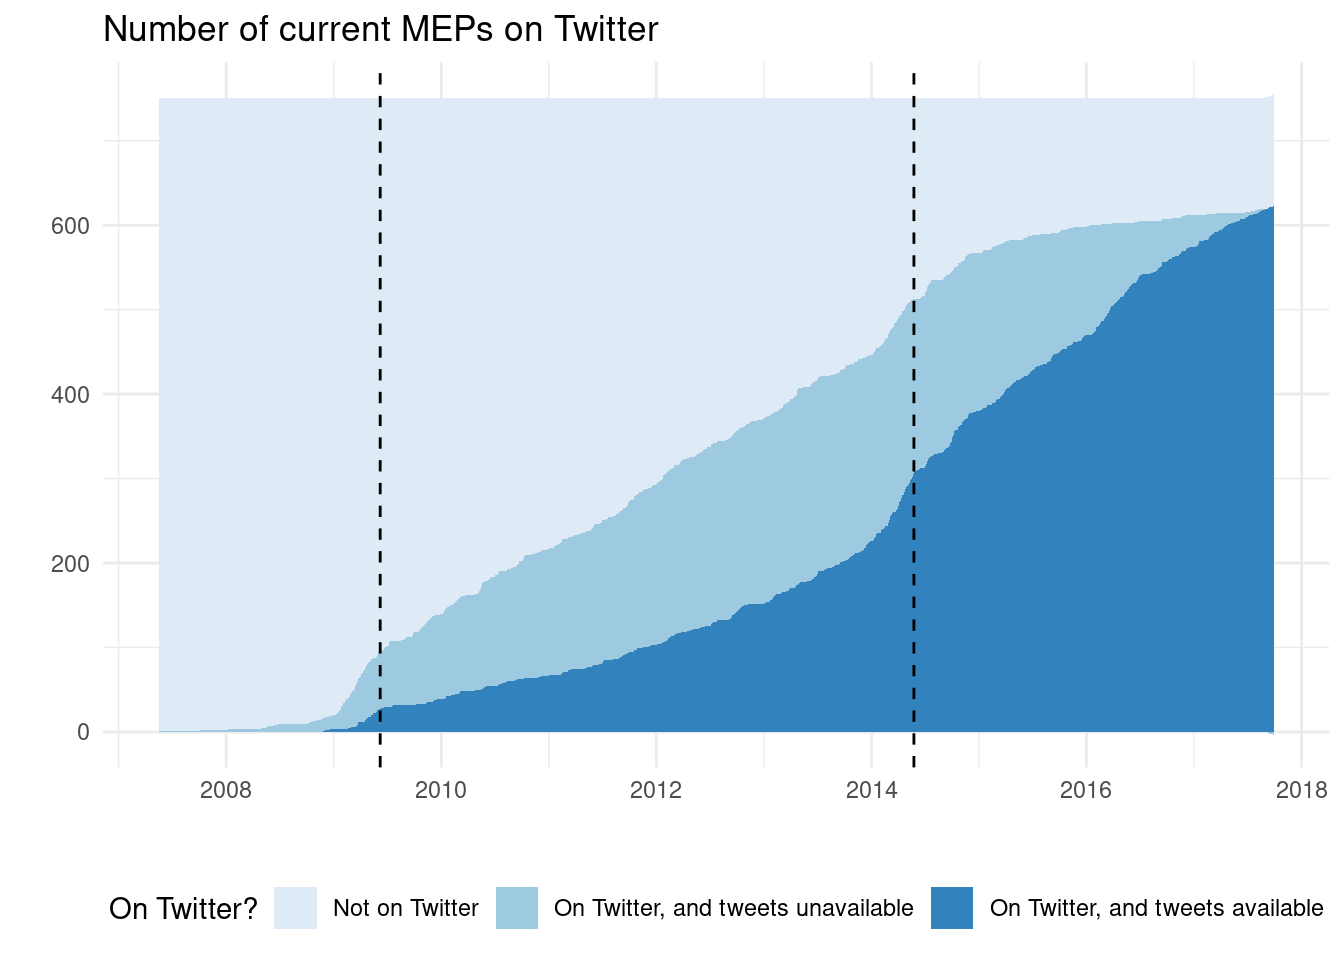
It is important to higlight that Twitter limits the ability to retrieve older tweets. More specifically, it allows to retrieve systematically the latest 3,200 tweets for each user. This is substantial, but not enough to cover all of the Twitter history of the most prolific MEP twitterati. More precisely, as of January 2017, 288 MEPs have tweeted more than 3,200 times. This means that at this stage it is possible to retrieve the full Twitter history of all MEPs effectively only for the last few weeks, and that the most frequent tweeters are left out of calculations for previous periods.
As a consequence, in terms of the current analsyis, the graph above should rather look as follows:
Hints from incomplete data
As a consequence of the limits imposed by Twitter on the possibility to systematically retrieve older tweets, analyses on earlier years are based on incomplete data, i.e. tweets by those MEPs who tweet less frequently. In spite of this substantial limitation, the following graphs still point at some trends that can be observed at least among those MEPs who post less frequently.
When did they tweet?
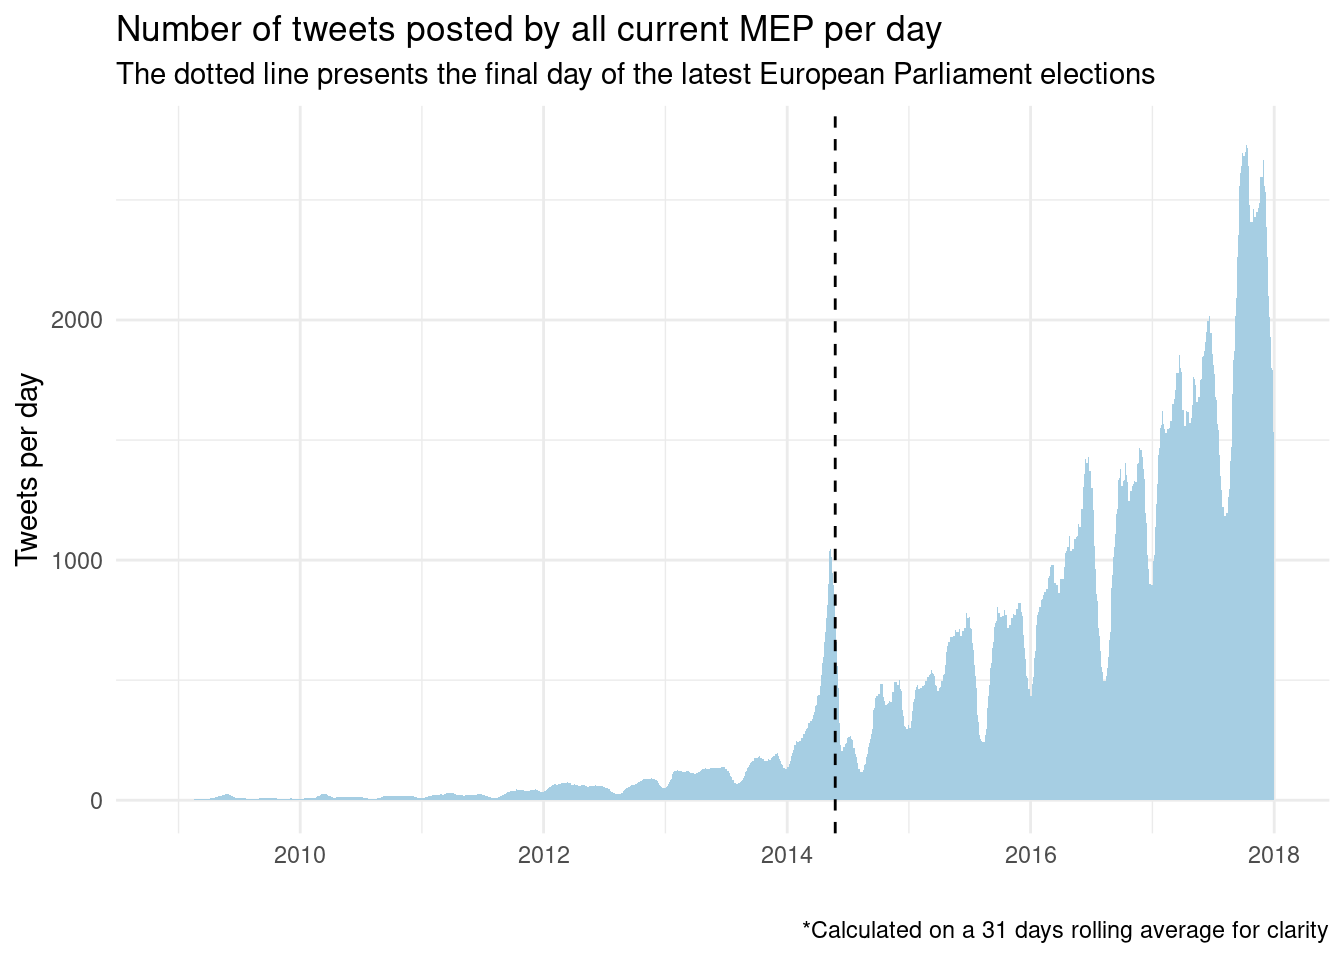
The graph shows a noticeable peak immediately preceeding the European Parliament elections in May 2014, as well as seasonal variations highlighting periods of lower and higher activity .
As appears more clearly from the following ridgeline graph, which includes yearly-adjusted data starting only with 2014, the seasonal trends can easily be explained: MEPs collectively tweet less in the summer (and in August in particular), as they do in the weeks around the new year.
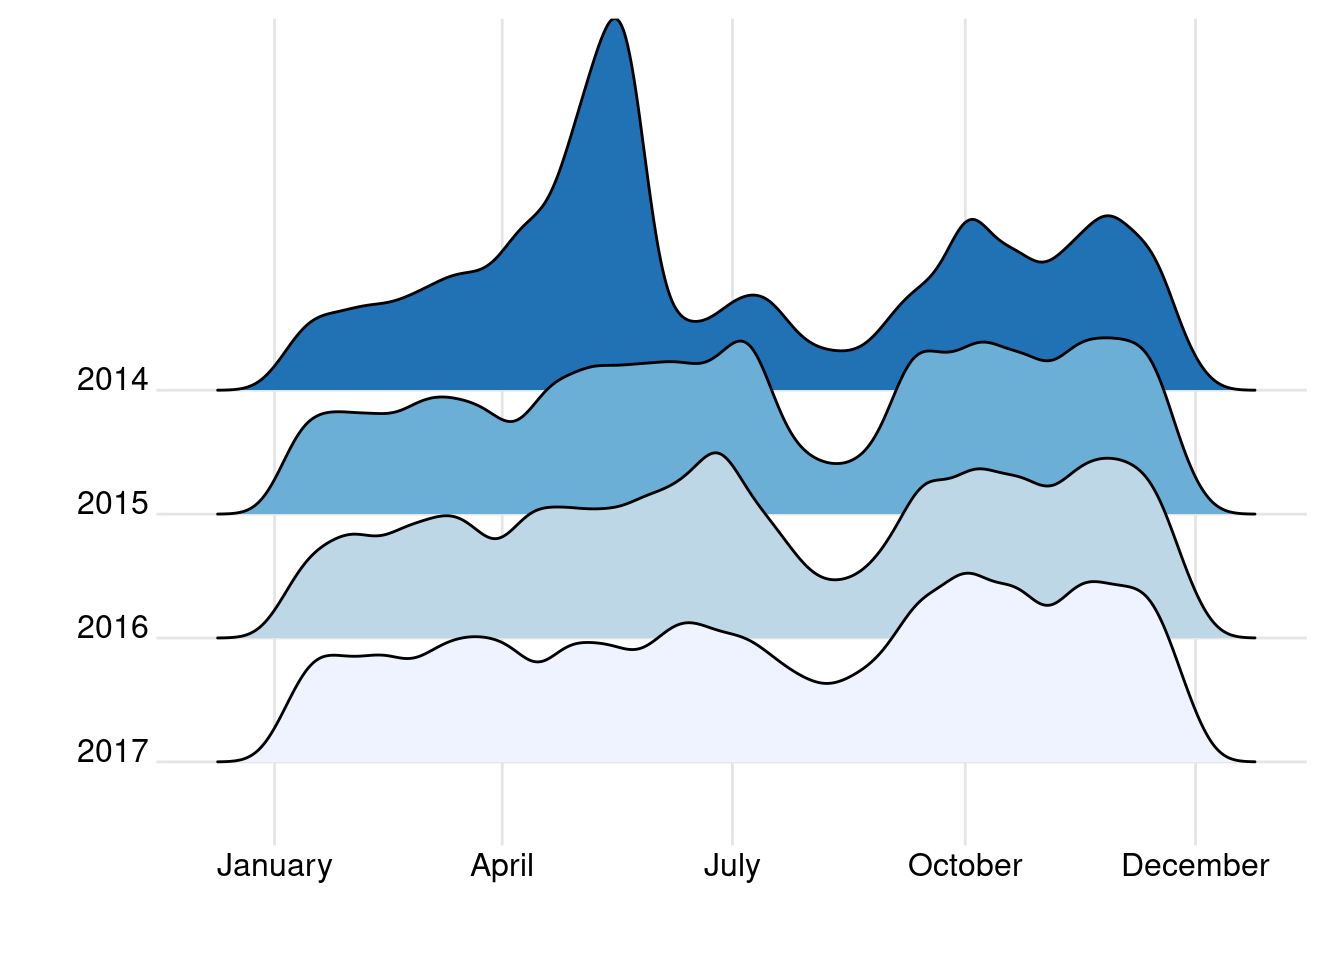
The trend is overall consistent, with some exceptions. The first is in the Spring of 2014, and is quite obviously related to the electoral campaign before the 2014 EP elections. The second is less accentuated but still noticeable around September 2017. A different, more granular visualisation may provide clues, without even looking at the contents of the tweets (I’m keeping that for a separate post).
Besides the overall trend of growth in recent months, some dates pop up from this heatmap-based calendar. Busier mid-week days are likely associated with EP sessions. On top, however, comes a day in the third week of September 2017: it’s 13 September, the day when Jean-Claude Juncker made his “State of the Union” speech, also known with the hashtag #SOTEU. Indeed, the heatmap shows that every year in September there is a day when MEP tweet most: #SOTEU time.3
What next?
This post scratched the surface of the EP twittersphere just looking at how much MEPs tweeted at a given point in time. The next post will start to deal with the “who” question, and only later we’ll finally look at the actual contents of tweets.
The code used to create the dataset is available on GitHub. An updated list of all MEPs with a Twitter account is available on GitHub, courtesy of Eliflab.↩
Again, keep in mind that these data refer to the number of current MEPs on Twitter: some of them were likely candidates also in 2009, but many weren’t.↩
#SOTEU speeches have been at the centre of two previous posts: Exploring #SOTEU speeches, and Interactive #SOTEU circle plots and wordclouds.↩