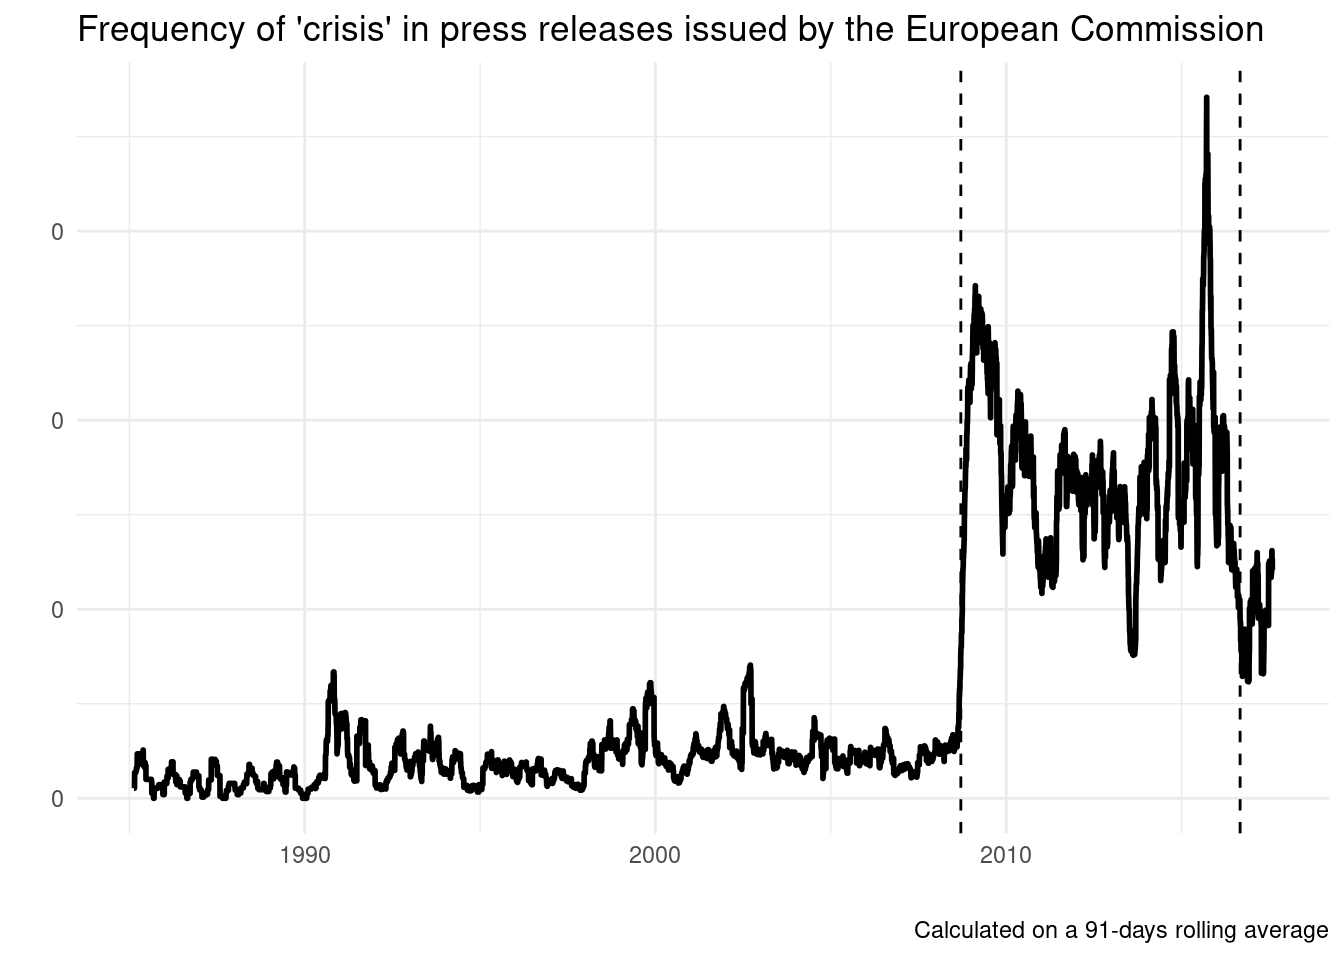
Looking at the archive of press releases and speeches published by the European Commission since 1985, it appears clearly that “crisis” entered the public vocabulary suddenly in 2008 and has quickly become a central keyword of public discourse, including that of EU institutions. 1
Embed code:
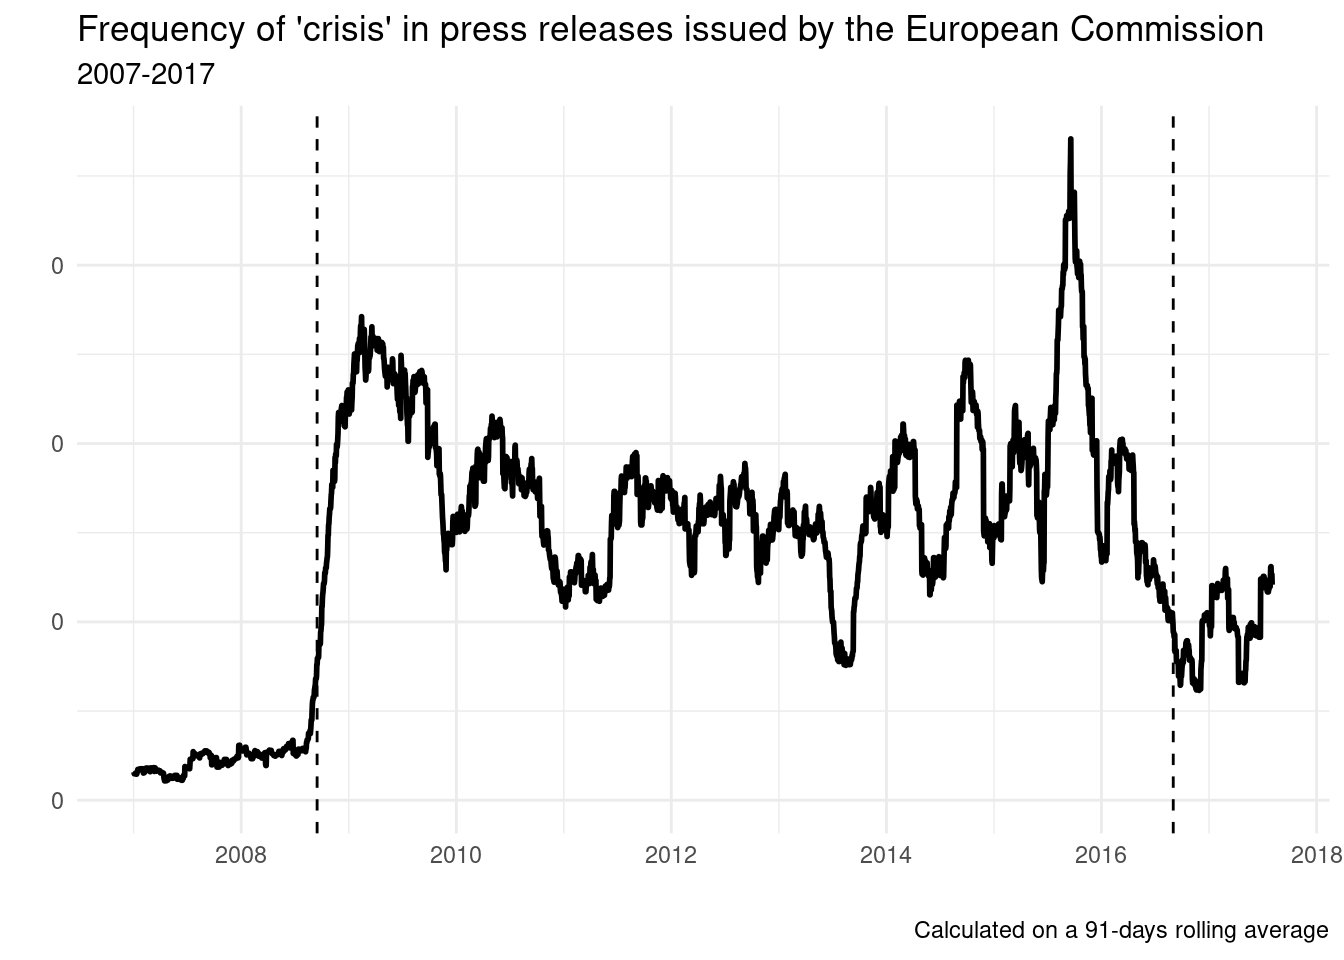
<iframe src="https://datavis.europeandatajournalism.eu/obct/giocomai/post/2017-10-04-crisis-what-crisis_files/figure-html/widgets/widget_hc_crisisFullTS.html" style="width:100%;height:500px;border:none;"></iframe>Zooming in on recent years, it appears clearly that the frequency of mentions to ‘crisis’ boomed starting with September 2008 and attenuated somewhat in the spring of 2016. The first dotted line in the graph below refers to 15 September 2008 (the day when Lehman Brothers filed for bankruptcy), the second is arbitrarily set at 1 September 2016, around the time when the frequency of mentions decreased substantially. It is worth mentioning, however, that even after this date, ‘crisis’ is still much more frequently mentioned than before 2008.
8 years of crisis - but what crisis?
Here’s a list of all the types of crisis that have been mentioned in press releases issued by the European Commission at least 10 times since 1985.
Embed code:
<iframe src="https://datavis.europeandatajournalism.eu/obct/giocomai/post/2017-10-04-crisis-what-crisis_files/figure-html/widgets/widget_dt_typesOfCrisis.html" style="width:100%;height:600px;border:none;"></iframe>That’s a lot of different types of crisis. Some of them are by far the most frequently mentioned (e.g. ‘economic crisis’), others are now not any more of concern (‘BSE crisis’, related to the so called “mad cow” disease). Here’s a graph showing the most frequently mentioned types of crisis.
Types of crisis
Embed code:
<iframe src="https://datavis.europeandatajournalism.eu/obct/giocomai/post/2017-10-04-crisis-what-crisis_files/figure-html/widgets/widget_hc_totalCrisisBarchart.html" style="width:100%;height:500px;border:none;"></iframe>There’s good reason to believe that different crises were prominent at different times, and indeed, this appears clearly from the following graph based on the number of mentions per year of the most common types of crisis.
Embed code:
<iframe src="https://datavis.europeandatajournalism.eu/obct/giocomai/post/2017-10-04-crisis-what-crisis_files/figure-html/widgets/widget_d3_steamGraph_crisis.html" style="width:100%;height:500px;border:none;"></iframe>There is another trend that clearly emerges from this graph: at least in its public discourse, the European Commission is leaving all types of crisis behind. Even the expression ‘economic crisis’, omnipresent until recently, barely appears any more. 2
Yes, but what was it all about?
These are numbers, and obviously tell only part of the story. But if you are interested in what was actually being said about it… pick your crisis, and find out more by reading the original quotes.
N.B. The first search box allows to search among types of crisis. The second search box on the right allows to filter by a second keyword within the results.
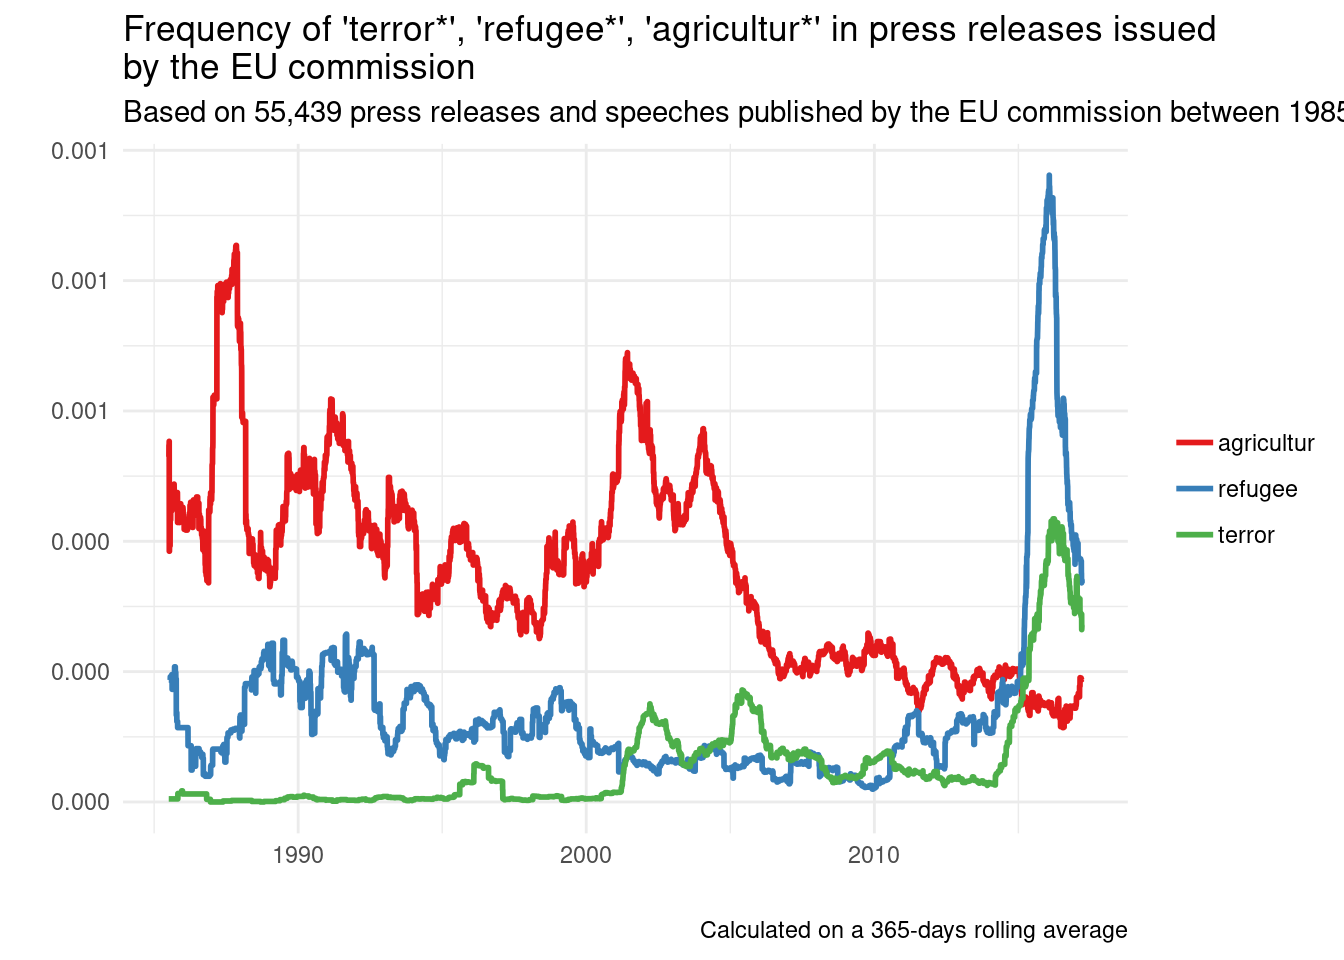
Life beyond crisis?
This post was focused on crisis. But what else has the Commission been talking about through all these years? Well, agriculture, for example. And certainly not terrorism, which was barely even mentioned before 2001.
If you’re curious about the frequency of other terms, you can test your hypotheses by inputting any term in the interactive graph available at this link.
Source code and terms of use.
The source code of this post is available in full on GitHub.
All of the contents of this blog, including graphs and code, are distributed under a Creative Commons license (BY). In brief, you can use and adapt all of the above as long you acknowledge the source: Giorgio Comai/OBC Transeuropa/#edjnet Feel free to embed the interactive graphs above in your own website or blog.
All the graphs in this post are based on a textual dataset created by extracting all press releases, statements, speeches, and announcements issued between January 1985 and 18 September 2017 and currently available in the online archive of the European Commission (55,439 items in total). The script used to generate this dataset is available on GitHub.↩
Unlike the previous timelines, this graph is based on the absolute number of mention, not relative frequency. As a consequence, and expecting that EU commissioners will talk of crisis between today and the end of the year, the downward trend will likely be slightly less steep than it appears at this stage.↩